Adaptive Network Optimizations for Faster Query Performance

At Snowflake, we strive to deliver “automatic performance” to all our customers. This performance is driven through multiple areas of investment: hardware-level optimization, intelligent resource allocation, proactive storage optimization, adaptive query execution, cost-based query optimization and AI-driven results reuse. These enhancements are delivered seamlessly to customers, providing transparent performance gains and cost-reduction without extra effort. The result is continuously improving economics and performance for all Snowflake workloads.
The challenge and how Snowflake solves it
Network-bound queries — that is, queries that spend a significant amount of time sending data across compute nodes in a virtual warehouse — are very common in traditional business intelligence (BI) and ad hoc analytical queries. We strive to ensure that our query engine is as efficient as possible and look for opportunities to reduce idle time (i.e., compute nodes waiting to process data) wherever possible. That’s why we recently introduced an adaptive optimization that significantly improves throughput between the compute nodes of a virtual warehouse. What’s the direct result of this improvement? Up to a 40% improvement in query efficiency.
To get a sense of the impact of this improvement, take a look at this snapshot of the following query and execution plan, based on a real customer query executed on Snowflake — both before and after the optimization.
Sanitized SQL
SELECT ARRAY_AGG(STRUCT(a.id, a.activation_date, b.some_column, c.another_column)) AS aggregated_array
FROM table_a a
INNER JOIN table_b b ON a.id = b.id
LEFT OUTER JOIN table_c c ON a.id = c.id
WHERE a.activation_date > '2024-01-01'
AND c.user_id IS NOT NULL
ORDER BY a.activation_date DESC NULLS FIRST
LIMIT 20001;
Before (12.2s) | After (6.6s) |
Figure 1. Query Plan Comparison
As you can see from the plan, we have a fairly simple query here: It joins 3 tables, performs a sort with a limit clause and aggregates some data. What makes this query special? Nothing. In fact, there are billions of queries just like this that execute on Snowflake everyday.
The before and after query plans are identical with minor differences in the time spent per operator. However, with no changes to the query plan, the total execution time improved by almost 2x.
When we look at the query-execution statistics, we get to see the optimization in action:
Before | After |
Figure 2. Profile Overview Comparison
We’re scanning the same amount of data from storage. The cache hit rate is the same. No differences in pruning. So, how does the query performance improve by 2x?
Details
When a compute cluster consisting of several nodes (servers) is started, a communication mesh is established. Snowflake uses a custom message protocol for communication between nodes that integrates with the database buffer management system. When queries execute, workers communicate over the mesh. There are different kinds of messages, and, for the purposes of this blog, you can think of these messages as containing rows.
For network-heavy workloads, encrypting and decrypting these messages often introduces significant overhead. With this improvement, however, we’ve introduced a highly parallelizable encryption mechanism that effectively doubles our available network bandwidth! We also make the network compression adaptive so that we only compress network messages when needed. This allows the query engine to better utilize compute resources, resulting in more efficient query execution.
Results
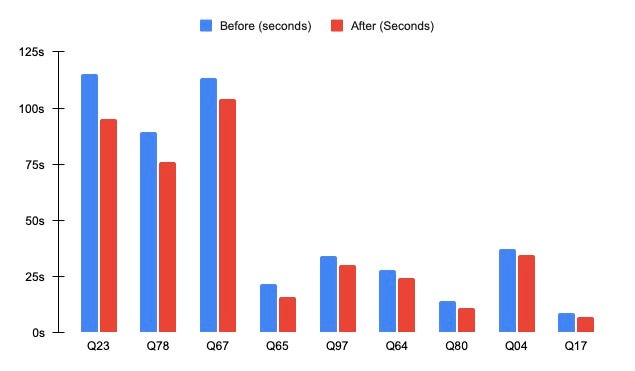
This kind of optimization significantly improves the performance of queries that require larger amounts of data to be exchanged over the interconnected network. To illustrate this, let’s look at how this improvement affects a set of TPC-DS queries (Figure 3).

Figure 3. Before and After - TPC-DS queries
We can see the improvement applies to a range of queries with different characteristics. The median improvement is just under 15%. Q65 shows a 25.6% improvement — an almost 5.5s gain on a 21s query. We observed a 10% improvement across the entire TPC-DS query set.
Conclusion
At Snowflake, we're on a continuous quest to enhance performance, with a particular focus on accelerating the core database engine, and we are proud to deliver these performance improvements through our weekly releases. In this blog post, we covered a recently released performance optimization that’s broadly applicable, highly impactful and now generally available to all customers.
To learn how Snowflake measures and prioritizes performance improvements, please read more about the Snowflake Performance Index here. For a list of key performance improvements by year and month, visit Snowflake Documentation.

