Snowflake Trail for Observability
Introducing Snowflake Trail: a set of Snowflake capabilities for developers to better monitor, troubleshoot, debug and take actions on pipelines, apps, user code and compute utilizations.
What's New: Observability in Snowflake
Observability shouldn’t be an afterthought. Snowflake Trail allows you to monitor, diagnose and troubleshoot, and gain insight into your apps, pipelines and compute.

Effortless Telemetry with one simple setting
Getting started with telemetry traditionally is a tedious process. Snowflake Trail eliminates the need for any agent installation, time-intensive setup or data export tasks, providing fast insights into application and pipeline performance.
With just one simple setting, you can gain visibility into the performance of your Snowpark code and its resource usage, so you can quickly diagnose and debug your apps and pipeline development. Events are all within Snowflake with no need for additional data transfer.
Reduce time to detect (TTD) and time to resolution (TTR)
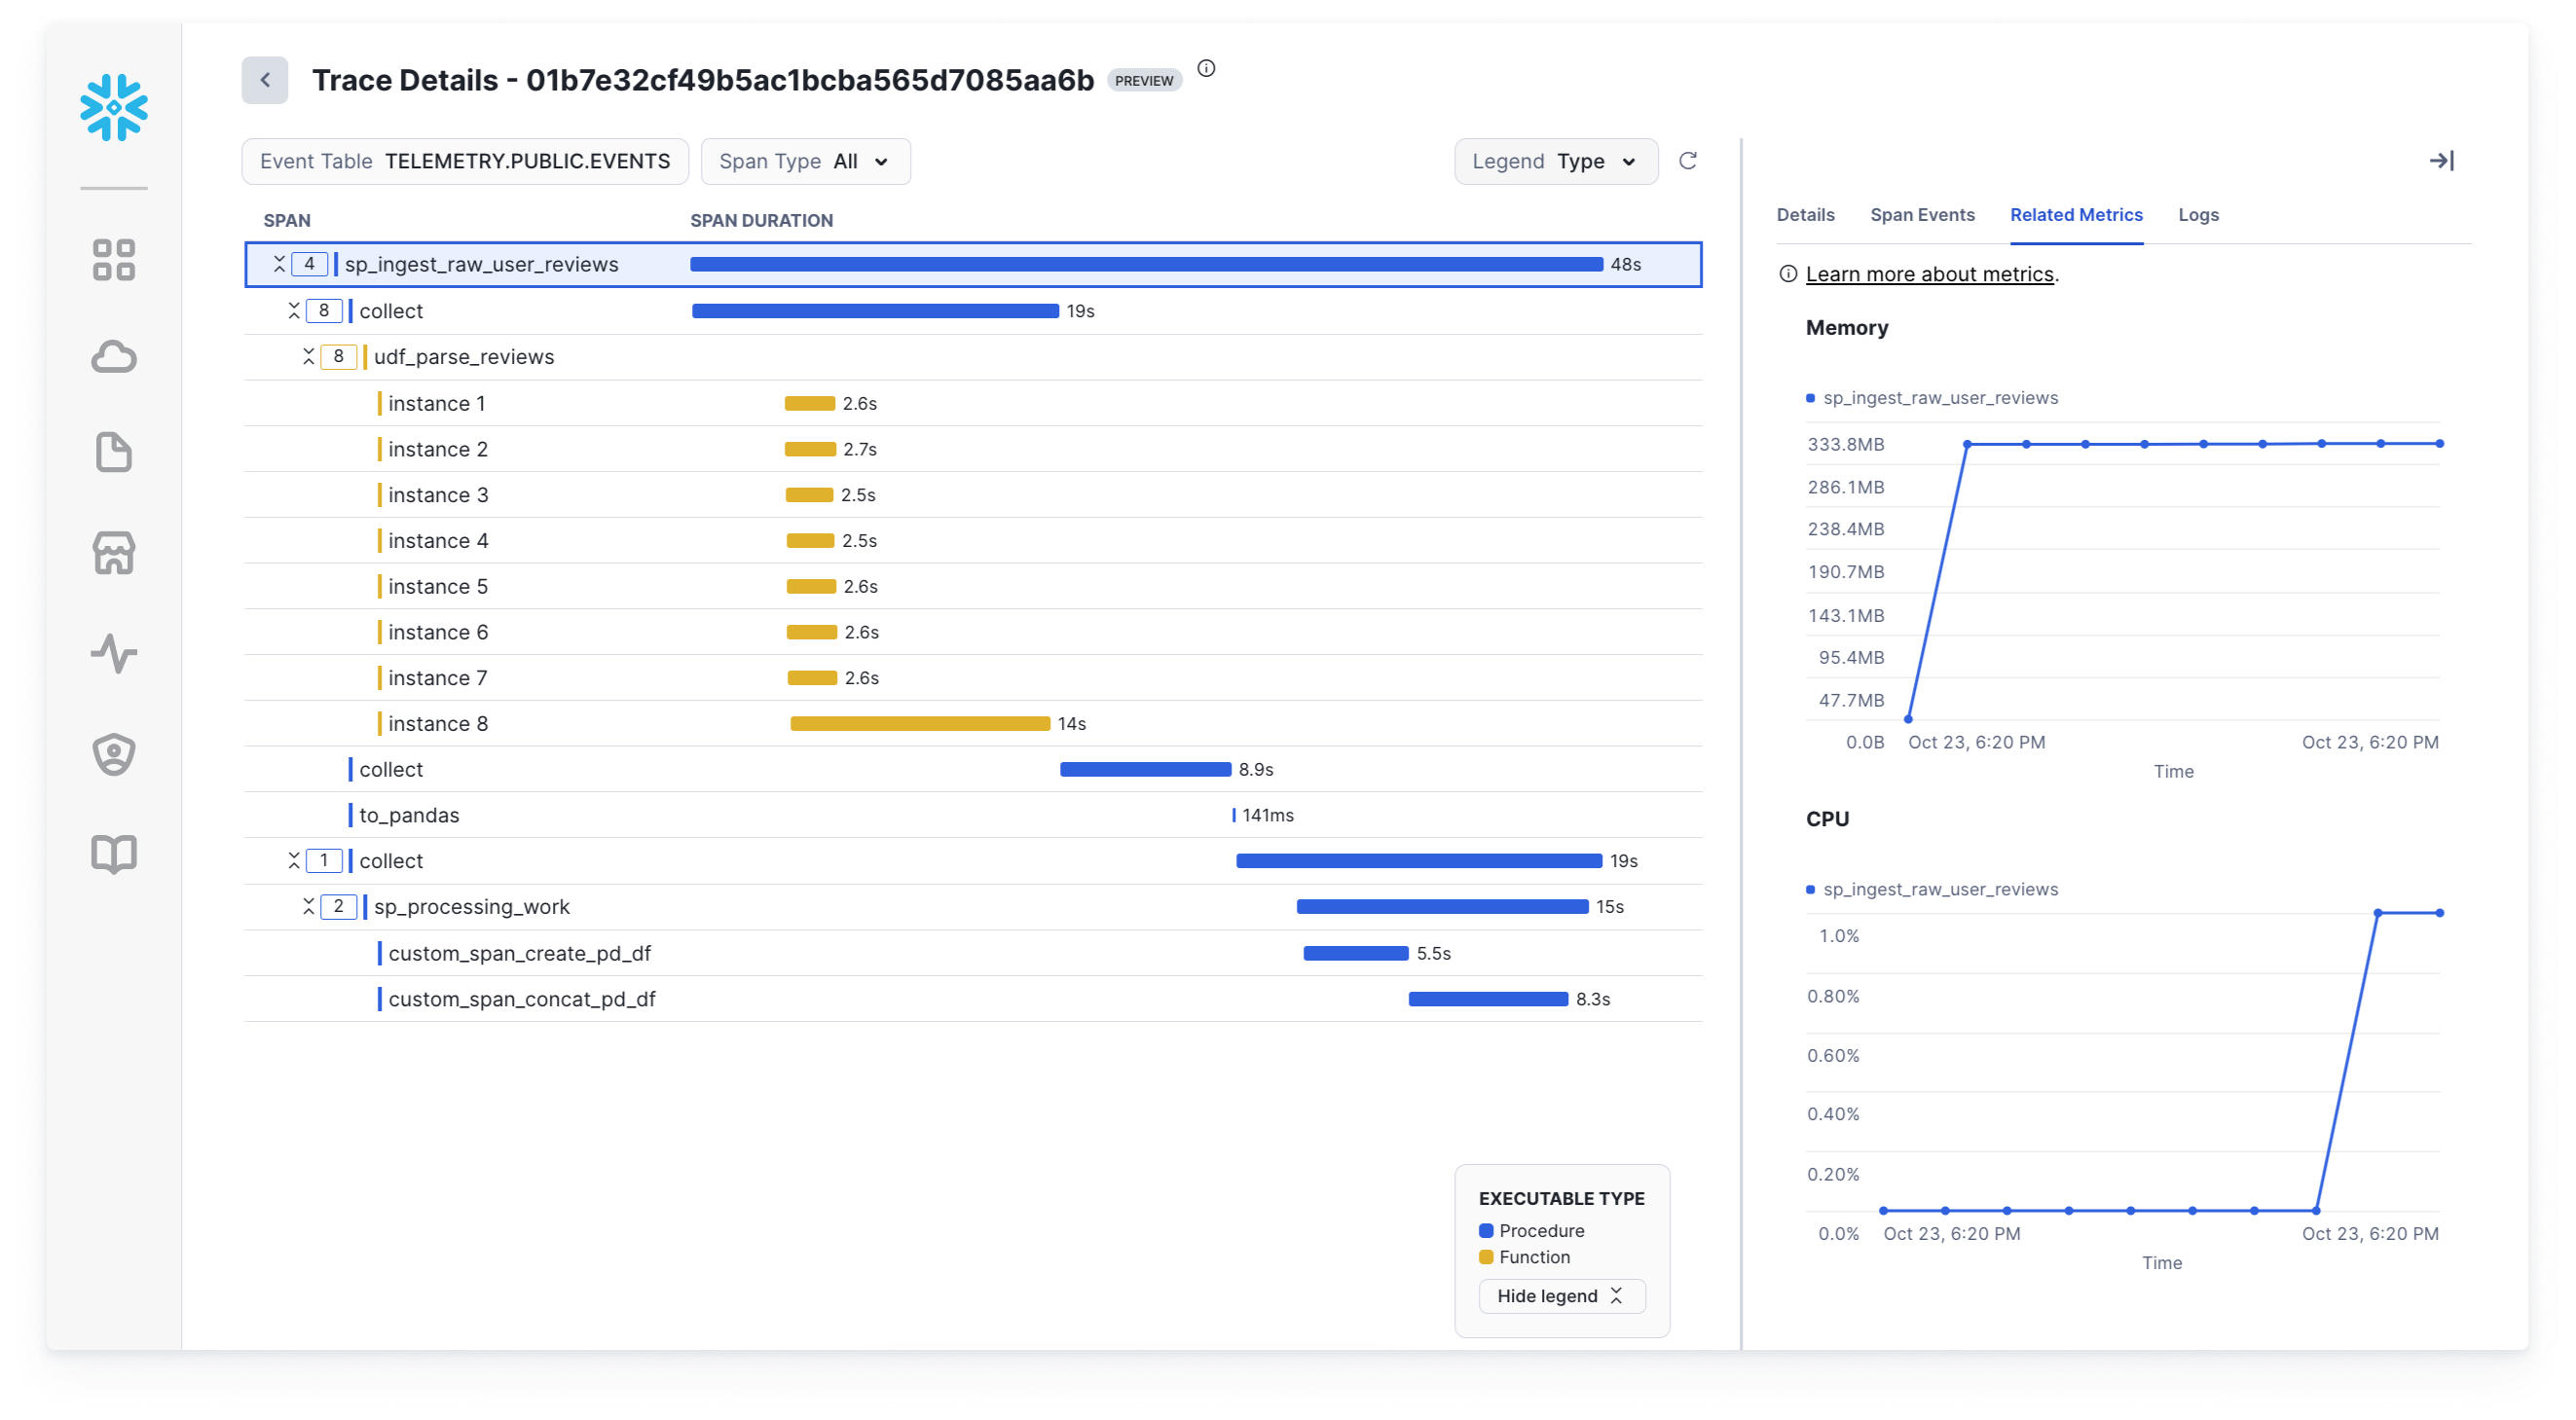
Snowflake Trail provides a comprehensive set of telemetry signals, including metrics, logs and span events, to help developers better understand their applications and pipelines. These signals unite in Snowsight, Snowflake’s user interface, to help developers debug and detect issues quickly.


Bring Your Own Tools (BYOT) or use Snowsight
Built with OpenTelemetry standards, schema and open ecosystem integrations in mind, Snowflake telemetry and notification capabilities integrate with some of the most favored developer tools, including Datadog, Grafana, Metaplane, Monte Carlo, PagerDuty and Slack. Or simply use Snowsight, where developers can monitor and trace their pipelines, apps and runtime usage directly within Snowflake.
Start your 30-DayFree Trial
Try Snowflake free for 30 days and experience the AI Data Cloud that helps eliminate the complexity, cost and constraints inherent with other solutions.


