Snowflake's ML-Powered Functions Enhance Speed and Quality of Decisions

Data analysts have a tough job. To keep pace with the explosive growth of data in their organization, they must balance the work required to derive accurate insights with the need to make fast decisions.
As they seek to understand and explain anomalies quickly, it takes valuable time and effort to dive deep into their data. And existing tools for common analysis, meant to make their lives easier, aren't always able to keep up with the volume of data they face daily. Analysts struggle to manage all of this while making sure the data they use in advanced analysis is securely processed.
Machine learning (ML) algorithms can solve some of these challenges. However, programming and data science knowledge gaps and complex compute infrastructure prevent analysts from adopting ML.
At Snowflake, we believe analysts can take advantage of the benefits of ML – if we are able to abstract away some of the complexity of ML frameworks.
That’s why at Summit 2023, we announced several ML-Powered Functions in Public Preview: These familiar SQL functions use ML to help analysts make higher quality decisions, faster. We’ll walk you through exactly how these ML-Powered Functions do so in this blog.
Forecasting
Analysts can now use the new Forecasting function to build more accurate time series forecasts with automated handling of seasonality, scaling, and more.
// This shows training & prediction for revenues in daily_revenue_v
create snowflake.ml.forecast revenue_projector(
    input_data => SYSTEM$REFERENCE('VIEW', 'daily_revenue_v'),
    timestamp_colname => 'ts',
    target_colname => 'revenue'
);

// The model is now ready for prediction.
call revenue_projector!forecast(
    forecasting_periods => 30, // how far out to project!
    config_object => {'prediction_interval': 0.9} // optional range of values with this probability
);
Using this functionality, analysts can train ML models that can be used to produce predictions again and again. With Forecasting, they can generate a forecasted estimate, as well as a range of estimates, known as prediction intervals. These highlight a likely range within which the forecasts are expected to fall.
This functionality makes life easier for analysts who, for example, are estimating future revenues and want accurate forecasts of sales volumes by store, without needing to lean on their data science team for help.
With Forecasting, analysts can generate predictions for either a single time series or multiple categories within a single time series. For example, if you are in retail, rather than forecasting aggregate sales for an item across stores, you can forecast sales per store. This Forecasting function allows you to get increased granularity for each forecast—with just one additional, simple line of code.
// Add series_colname to predict sales by category.
create snowflake.ml.forecast revenue_projector_by_store(
    input_data => SYSTEM$REFERENCE('VIEW', 'daily_revenue_v'),
    timestamp_colname => 'ts',
    target_colname => 'revenue',
    series_colname => 'store_id'
);

// The model is now ready for prediction.
call revenue_projector_by_store!forecast(
    forecasting_periods => 30, // Predict sales for one month.
);
You can further improve the quality of your predictions by including exogenous variables— whether they are numeric or categorical. So for example, if you know that public holidays have a big impact on your retail sales volumes, including holidays as an exogenous variable should improve the accuracy of your foreasts.
Forecasting also allows you to generate predictions for custom time horizons, such as 4 hours, 1 day, or 7 days. We are hopeful this flexibility can help you get forecasts tailored to your specific needs and timeframes without needing to lean on your data science team for help.
Anomaly Detection
What if analysts could use ML to identify outliers and trigger alerts? Now they can with our new Anomaly Detection function. Analysts can also use it to find outlier events that should be investigated for suspicious activity and to find unlikely-to-happen-again situations that should be excluded from future analysis.
Anomaly Detection specifically predicts anomalies for a single time series or multiple categories within one time series. This ML-powered anomaly detection method is helpful if you want to replace static thresholds for identifying outliers, and instead rely on a model that creates a smart, dynamic baseline for your data.
To ensure that you can control the number of false positives this function surfaces, this function allows you to adjust the size of the prediction interval used to flag anomalies. You can then use Snowflake Tasks and Alerts to automatically get notified when an anomaly is flagged, as shown below.
-- Set up a task to train your model on a weekly basis.
create or replace task train_anomaly_detection_task
warehouse = LARGE_WAREHOUSE
SCHEDULE = 'USING CRON 0 0 * * 0 America/Los_Angeles' -- Run at midnight every Sunday.
as EXECUTE IMMEDIATE
  $$
  begin
    create or replace snowflake.ml.ANOMALY_DETECTION my_model(input_data => SYSTEM$REFERENCE('VIEW', 'view_of_your_input_data'),
       timestamp_colname => 'ts',
       target_colname => 'y',
       label_colname => '');
  end;
  $$;

-- Start your task's execution.
alter task train_anomaly_detection_task resume;


-- Create a table to store your anomaly detection results.
create or replace table anomaly_detection_results (
    ts timestamp_ntz,
    y float,
    forecast float,
    lb float,
    ub float,
    is_anomaly boolean,
    percentile float,
    distance float
);


-- Call your model to detect anomalies on a daily basis.
create or replace task detect_anomalies_task
warehouse = LARGE_WAREHOUSE
SCHEDULE = 'USING CRON 0 0 * * * America/Los_Angeles' -- Run at midnight, daily.
as EXECUTE IMMEDIATE
  $$
  begin
    call my_model!detect_anomalies(
     input_data => SYSTEM$REFERENCE('VIEW', 'view_of_your_data_to_monitor'),
                  timestamp_colname =>'ts',
                  target_colname => 'y',
                  config_object => {'prediction_interval': 0.99});

    insert into anomaly_detection_results (ts, y, forecast, lb, ub, is_anomaly, percentile, distance)
        select * from table(result_scan(last_query_id()));
  end;
  $$;

-- Start your task's execution.
alter task detect_anomalies_task resume;


-- Setup alert based on the results from anomaly detection
CREATE OR REPLACE ALERT anomaly_detection_alert
  WAREHOUSE = LARGE_WAREHOUSE
  SCHEDULE = 'USING CRON 0 1 * * * America/Los_Angeles' -- Run at 1 am, daily.
  IF (EXISTS (select * from anomaly_detection_results where is_anomaly=True and ts > dateadd('day',-1,current_timestamp()))
  THEN
  call SYSTEM$SEND_EMAIL(
        'SNOWML_ANOMALY_DETECTION_ALERTS',
        '[email protected]',
        'Anomaly Detected in data stream',
        concat(
            'Anomaly Detected in data stream',
            'Value outside of confidence interval detected'
        )
    );

-- Start your alert's execution.
alter alert anomaly_detection_alert resume;
Contribution Explorer
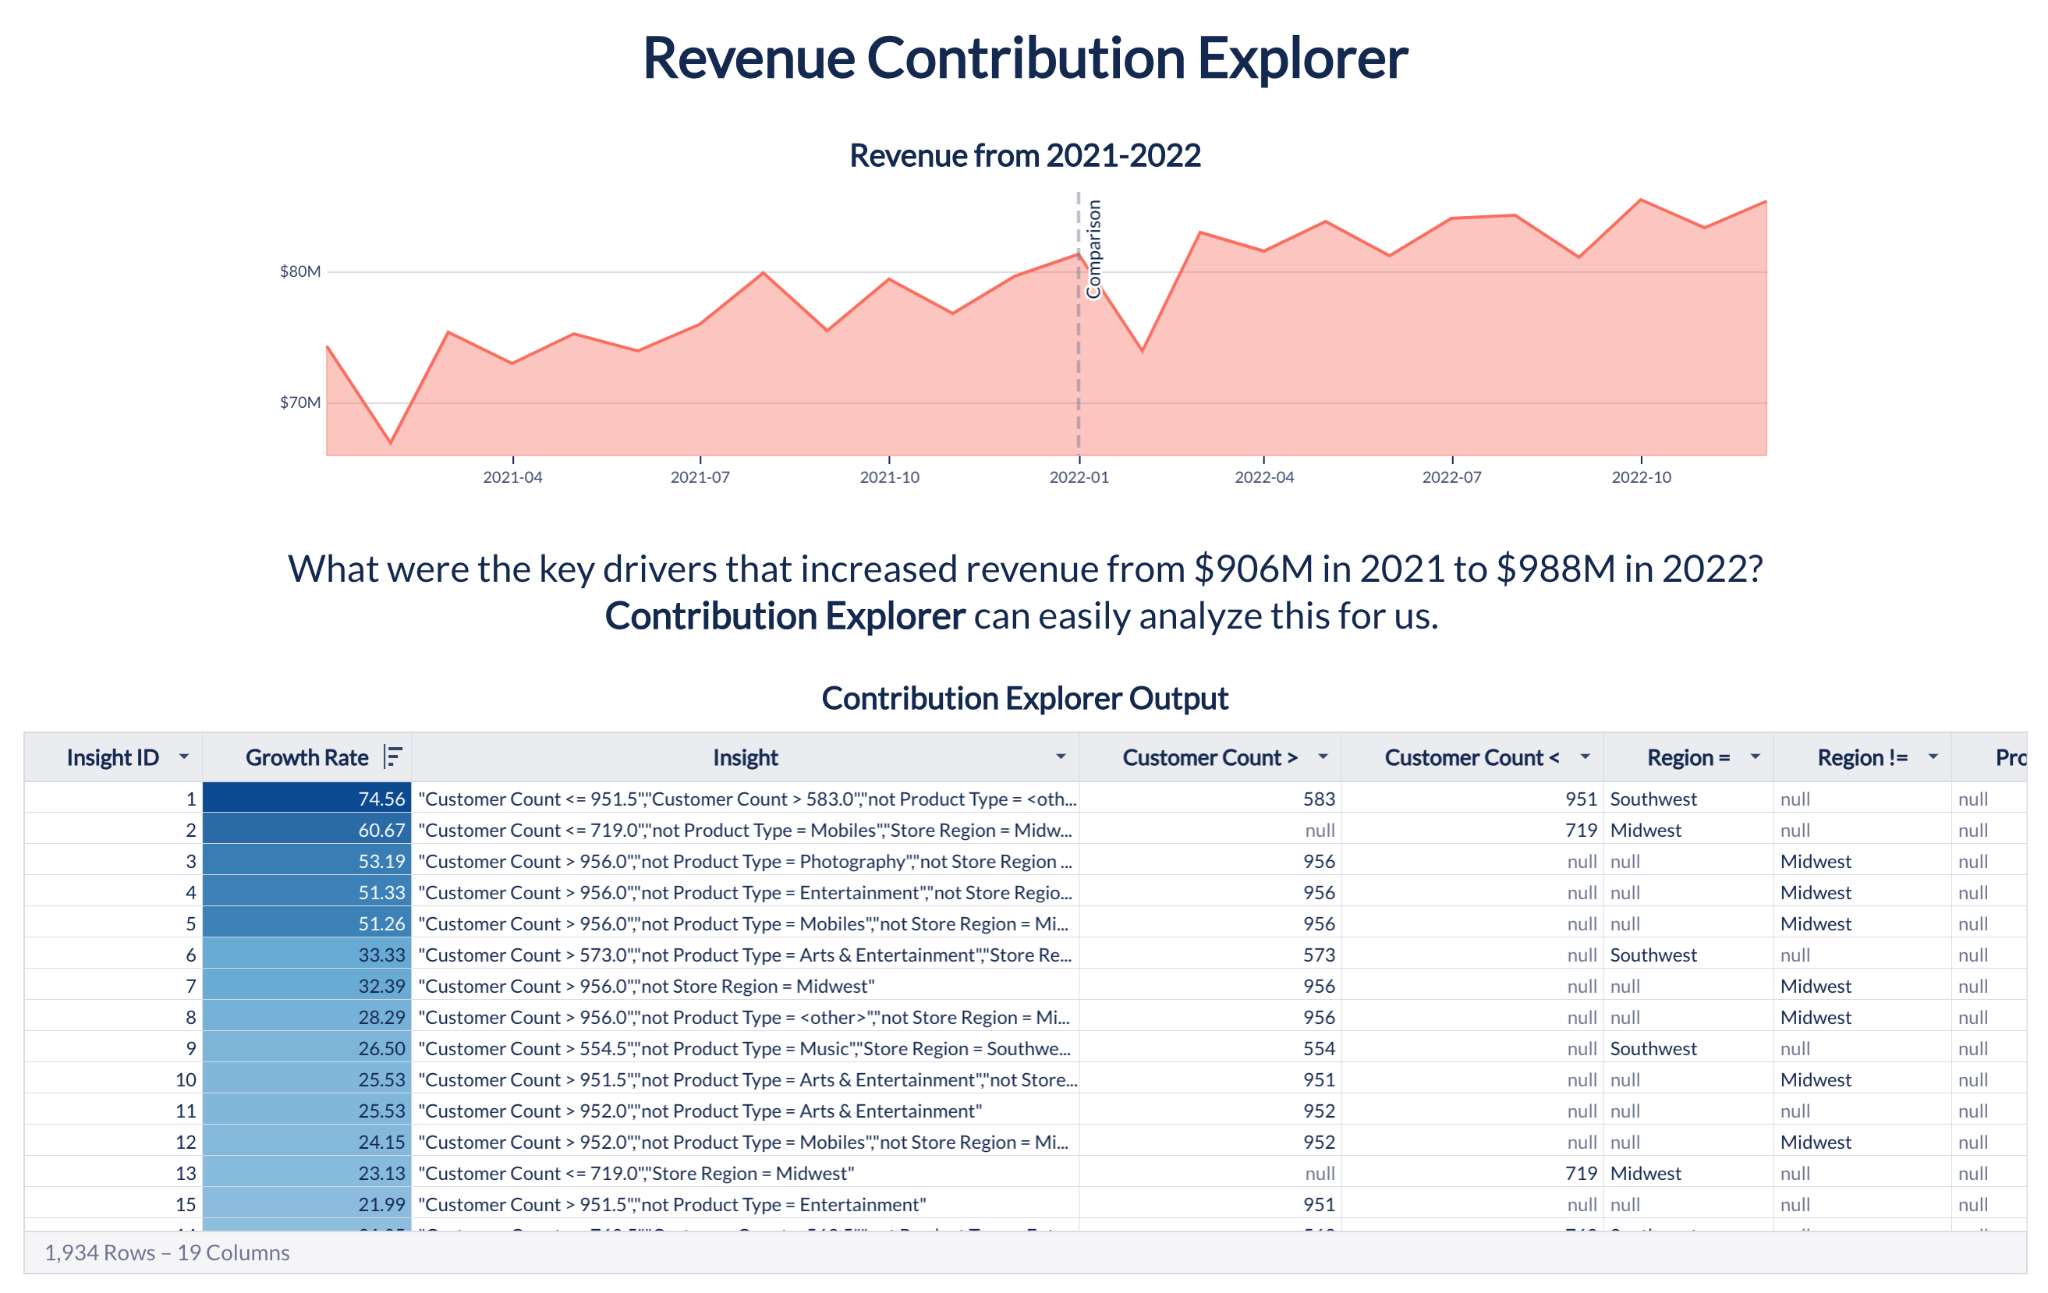
Now, analysts can use ML to quickly identify the dimensions contributing to the change of a given metric across two different user-defined time intervals. If you see an anomaly in a key business metric such as sales or usage, you want to know the contributors to that anomaly and find the root cause. Contribution Explorer mines millions of combinations of dimensions and their values to find the dimensions and their values — called “segments” with the most surprise. For example, you see a particular customer in a certain region may have suddenly stopped using your product.
In fact, you can use Contribution Explorer to also regularly analyze the metric to find hidden gems — even if there is no apparent anomaly at the aggregate level. For example, even if you see the sales aren’t anomalous, sales to two different customers may have grown and fallen at the same time.
with input as (
    select
       // Select dimensions to "mine"
       {   'country': input_table.dim_country,
            'vertical': input_table.dim_vertical
        } as categorical_dimensions,
        {
        } as continuous_dimensions, // less common but available
        // This is the metric for comparison
        input_table.kpi,
        // Label control & test periods for comparison
        iff(ds between '2020-08-01' and '2020-08-20', TRUE, FALSE) as label
    from input_table
    where (ds between '2020-05-01' and '2020-05-20')
    or (ds between '2020-08-01' and '2020-08-20')
)
// Now use the above data to compare contributions of dimension segments
select res.* from input, table(
snowflake.ml.top_insights(
    input.categorical_dimensions,
    input.continuous_dimensions,
    CAST(input.kpi as float),
    input.label
)
over (partition by 0)
) res order by res.relative_change desc;
What makes Snowflake’s ML-Powered Functions unique?
Elasticity, Near-Zero Operations, Data Governance, and more
When using Snowflake’s ML-Powered Functions, it’s easy to scale from one to millions of dimension-value combinations — it’s all possible with the elasticity and near-zero operations of Snowflake’s engine. Plus, you can integrate calls to Forecasting, Anomaly Detection, and Contribution Explorer into your data pipelines like any other SQL function. Using these functions with Snowflake Tasks and Alerts allows you to automatically train new models each week as you get new data, generate predictions each day or hour (as needed), and receive alerts when you detect an anomaly and should investigate.
Regardless of how you use ML-Powered Functions, you get Snowflake’s consistent data governance across function inputs and outputs.
Range of ML Capabilities
ML-Powered Functions perfectly complement the data science-focused Snowpark ML functions. The former take care of model training, evaluation, and more with minimal effort for an analyst, or a busy decision maker, while the latter provides a rich and flexible toolbox for the data scientist to put together their own models.
Together, they provide a range of options to choose from depending on the nature of the problem and the data science effort you want to put in to solve the problem.
Extract Insights for Machine Learning from BI Tools, like Sigma
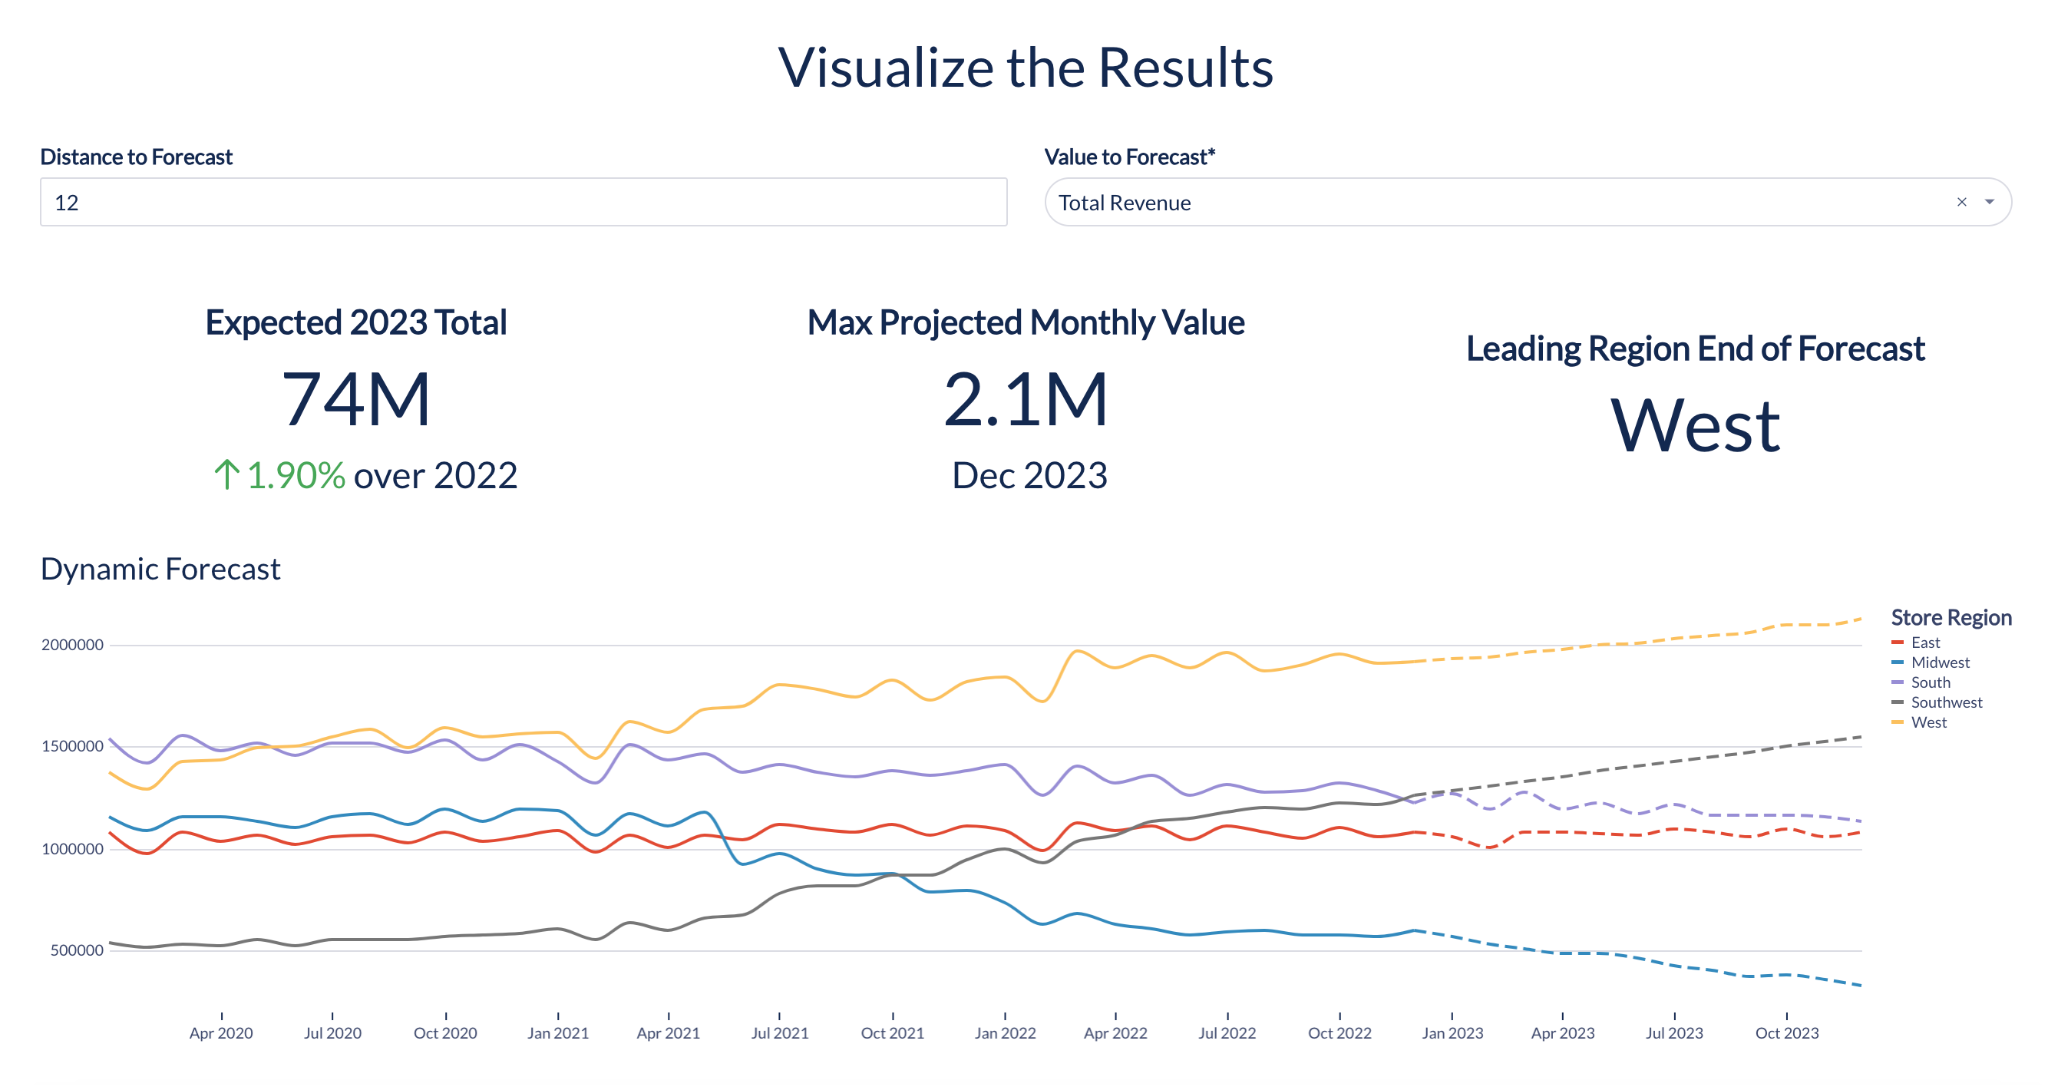
We’re proud to partner with Sigma, a BI tool that supports Snowflake's ML-Powered Functions and provides a user-friendly interface for business users to extract insights from ML. It offers front-end support for Snowflake's Time Series Forecasting and Contribution Explorer.
By enabling these functions in your Snowflake account and granting access to Sigma's role, you can use Sigma Datasets, which provide a simplified starting point for both tabular and visual analysis. To use Time Series Forecasting or Contribution Explorer, identify the desired table or dataset, group the data based on preferred granularity, and create aggregate metrics for exploration. Prepare the table, create a warehouse view, define a Dataset with CustomSQL against it and apply the corresponding function using the provided syntax.
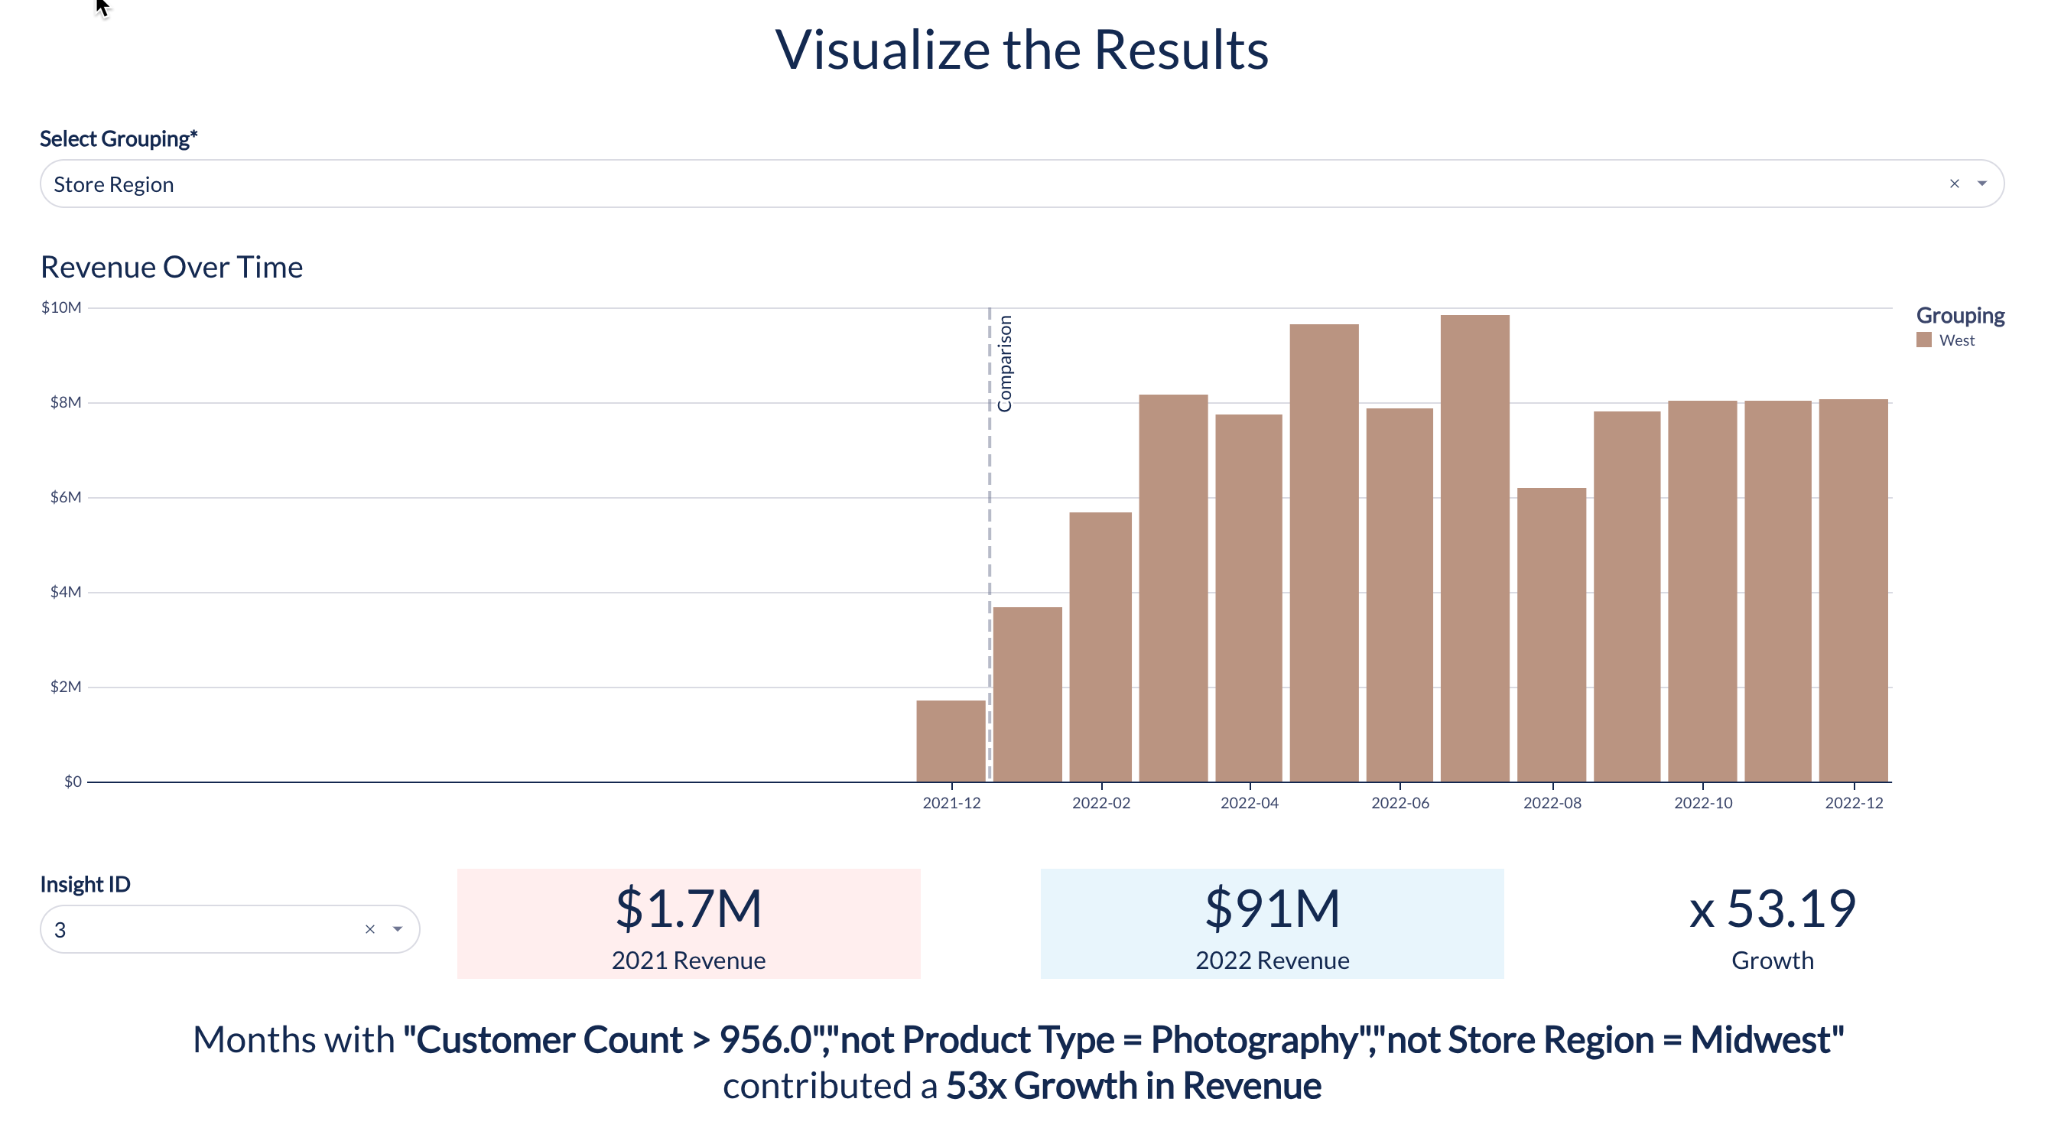
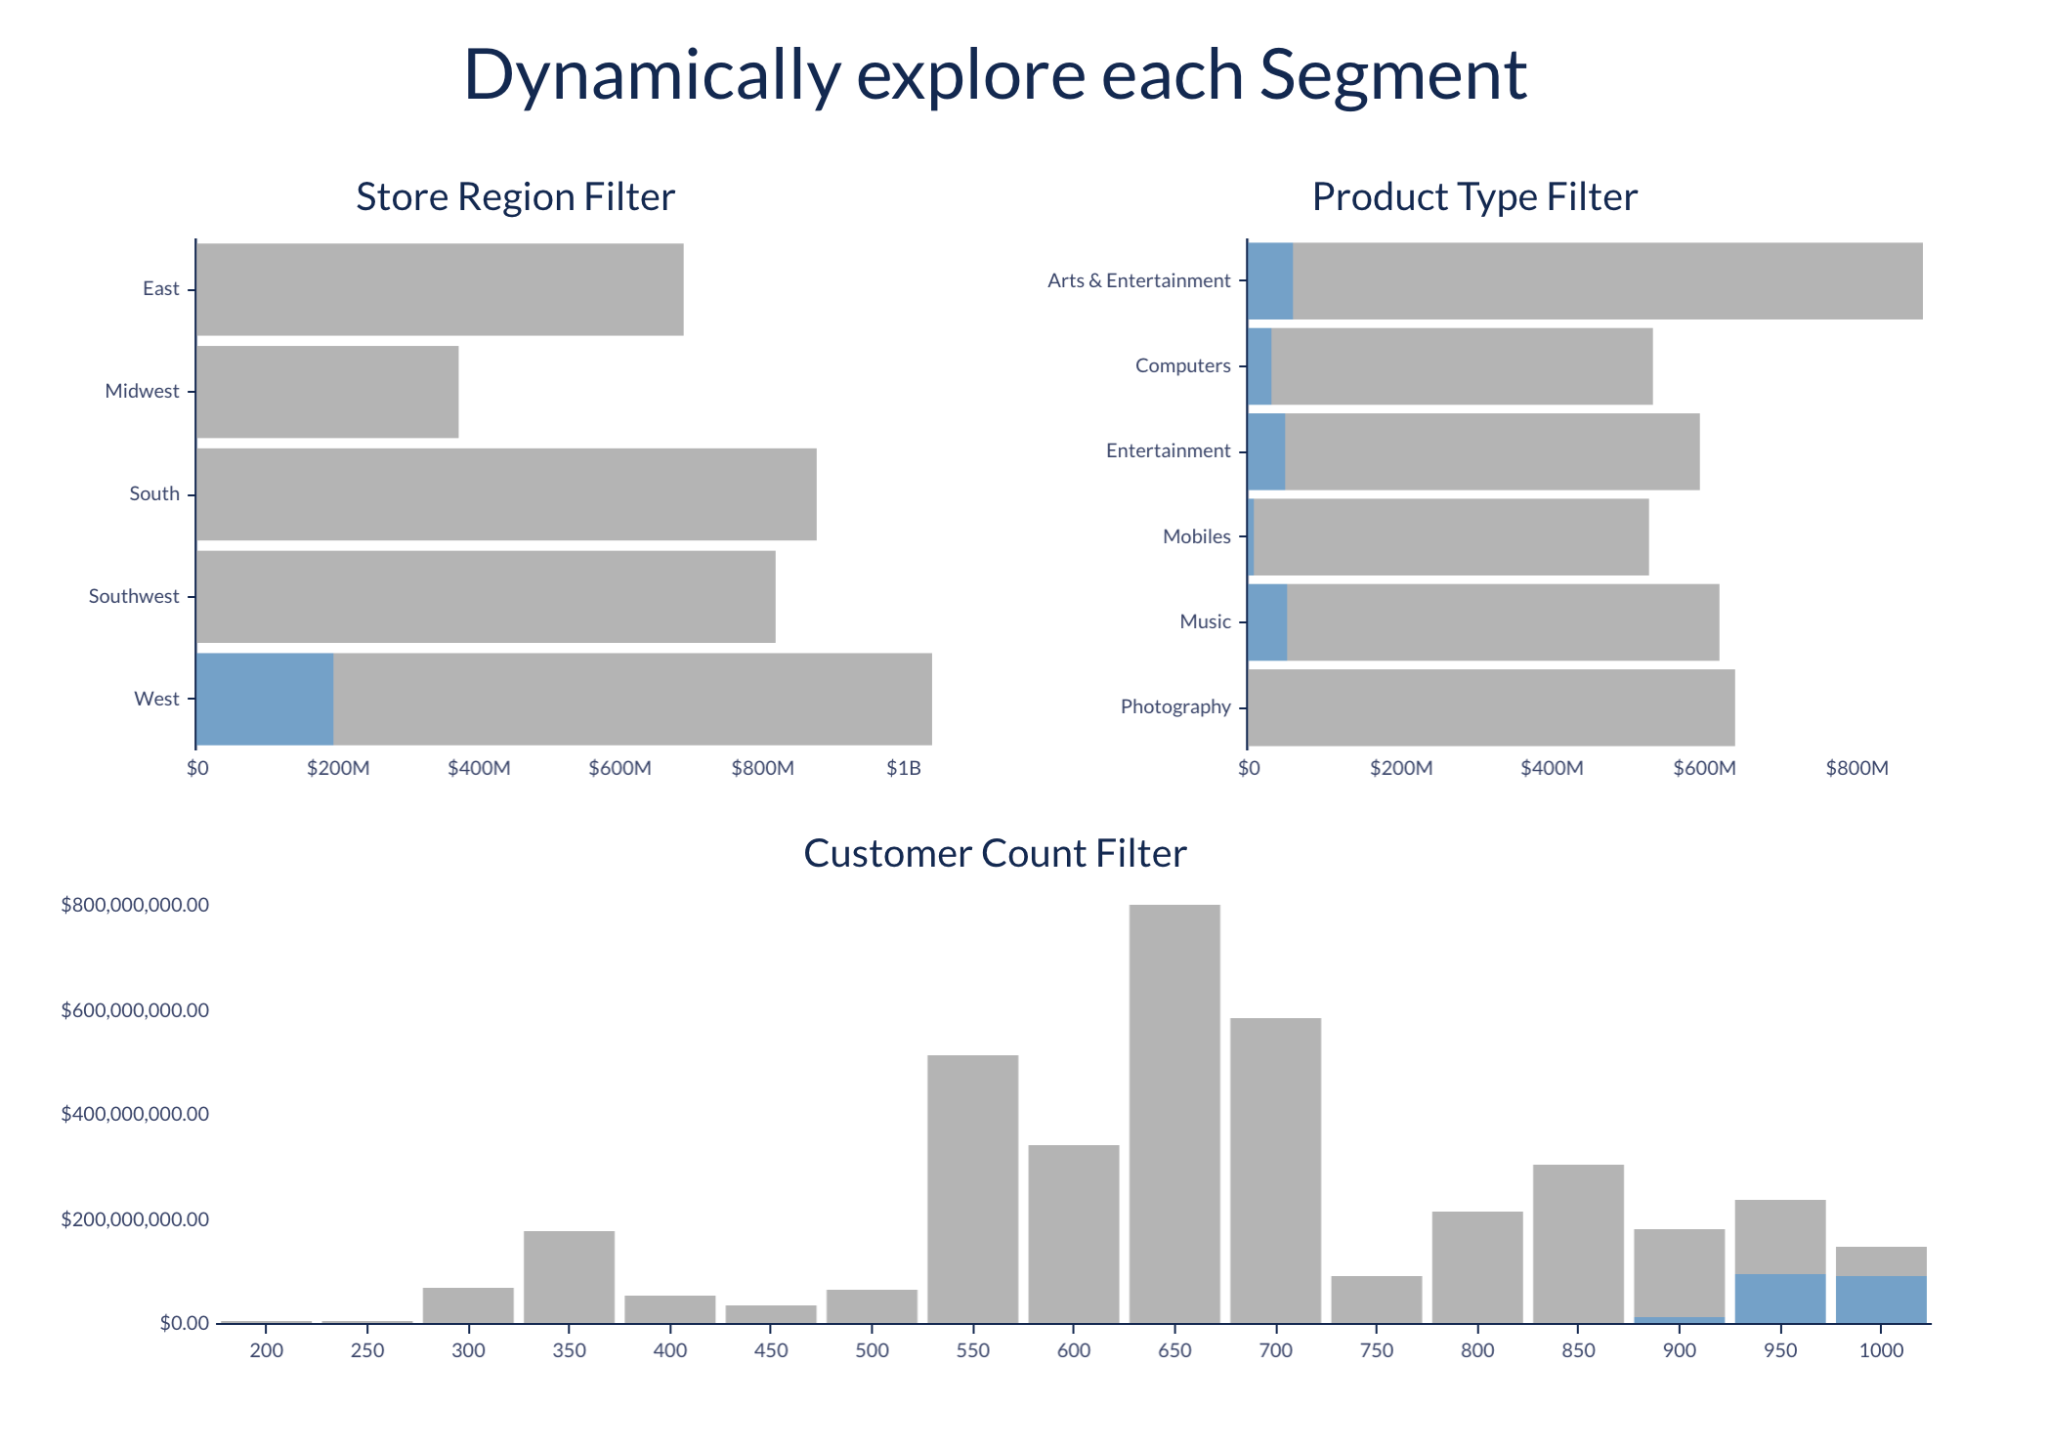
Time Series Forecasting outputs a time-based set of predictions. Contribution Explorer provides a sorted list of segments that contributed the most to the growth of the key metric. Both datasets can be seamlessly integrated into workbooks, enabling visualization, exploration, and joining with other warehouse tables. For enhanced interactivity, replace static variables in Custom SQL with parameters, empowering users to modify functions within the workbook.
Forecasting

Contribution Explorer


This dataset can be seamlessly used in any workbook, offering easy visualization, exploration, and joining with other tables in your warehouse for a comprehensive understanding of expected future metrics — try it for yourself.
What’s next?
Early customer feedback has enabled us to work on extending the functions mentioned above and expanding the set of capabilities in new and exciting ways. Anomaly Detection and Contribution Explorer start with time-series data but don’t have to stop there. They apply to other data as well — to find outliers among customers or for comparing cohorts of users to find the most interesting segments that contribute to the difference between the cohorts. In fact, we are working to broaden the data covered by ML-Powered Functions.
As we take these capabilities further, we are looking for select customers to take them for a spin and provide feedback. Stay tuned and talk to your account teams to access the future previews as they become available. And please share your use cases here. The future of what you can do with ML is almost limitless — ML-Powered Functions are planning to grow the capabilities you can access for better business outcomes, without having to keep up with ever-expanding ML research.
To learn more about ML-Powered Functions, visit Snowflake documentation.


