Unleash Advanced Geospatial Analytics in Snowflake
Both businesses and governments have been forced to respond to the global pandemic by developing interactive user experiences and spatial applications using location-based data sets to visualize COVID cases, communicate confinement measures, and track vaccine rollout progress.
In addition, businesses in the consumer packaged goods (CPG), retail, logistics, telecommunications, and property verticals have all had to adjust to rapidly changing consumer behaviors by using geospatial analysis to drive fundamental network optimization decisions.
For almost all organizations today, the majority of data being processed and analyzed has some sort of spatial component, and a key challenge for developers and data scientists is how to seamlessly unlock the insights held within this volume of information.
We were excited to see in 2020 that Snowflake launched a series of geospatial functions and building on these sound foundations, we have developed an exciting Spatial Extension for the Snowflake platform.
With this development, data scientists and analysts can execute more than 60 open-source geospatial functions, right inside the Snowflake platform. Not only that, we have also integrated key geospatial data sets into Snowflake Data Marketplace, further streamlining data enrichment workflows.
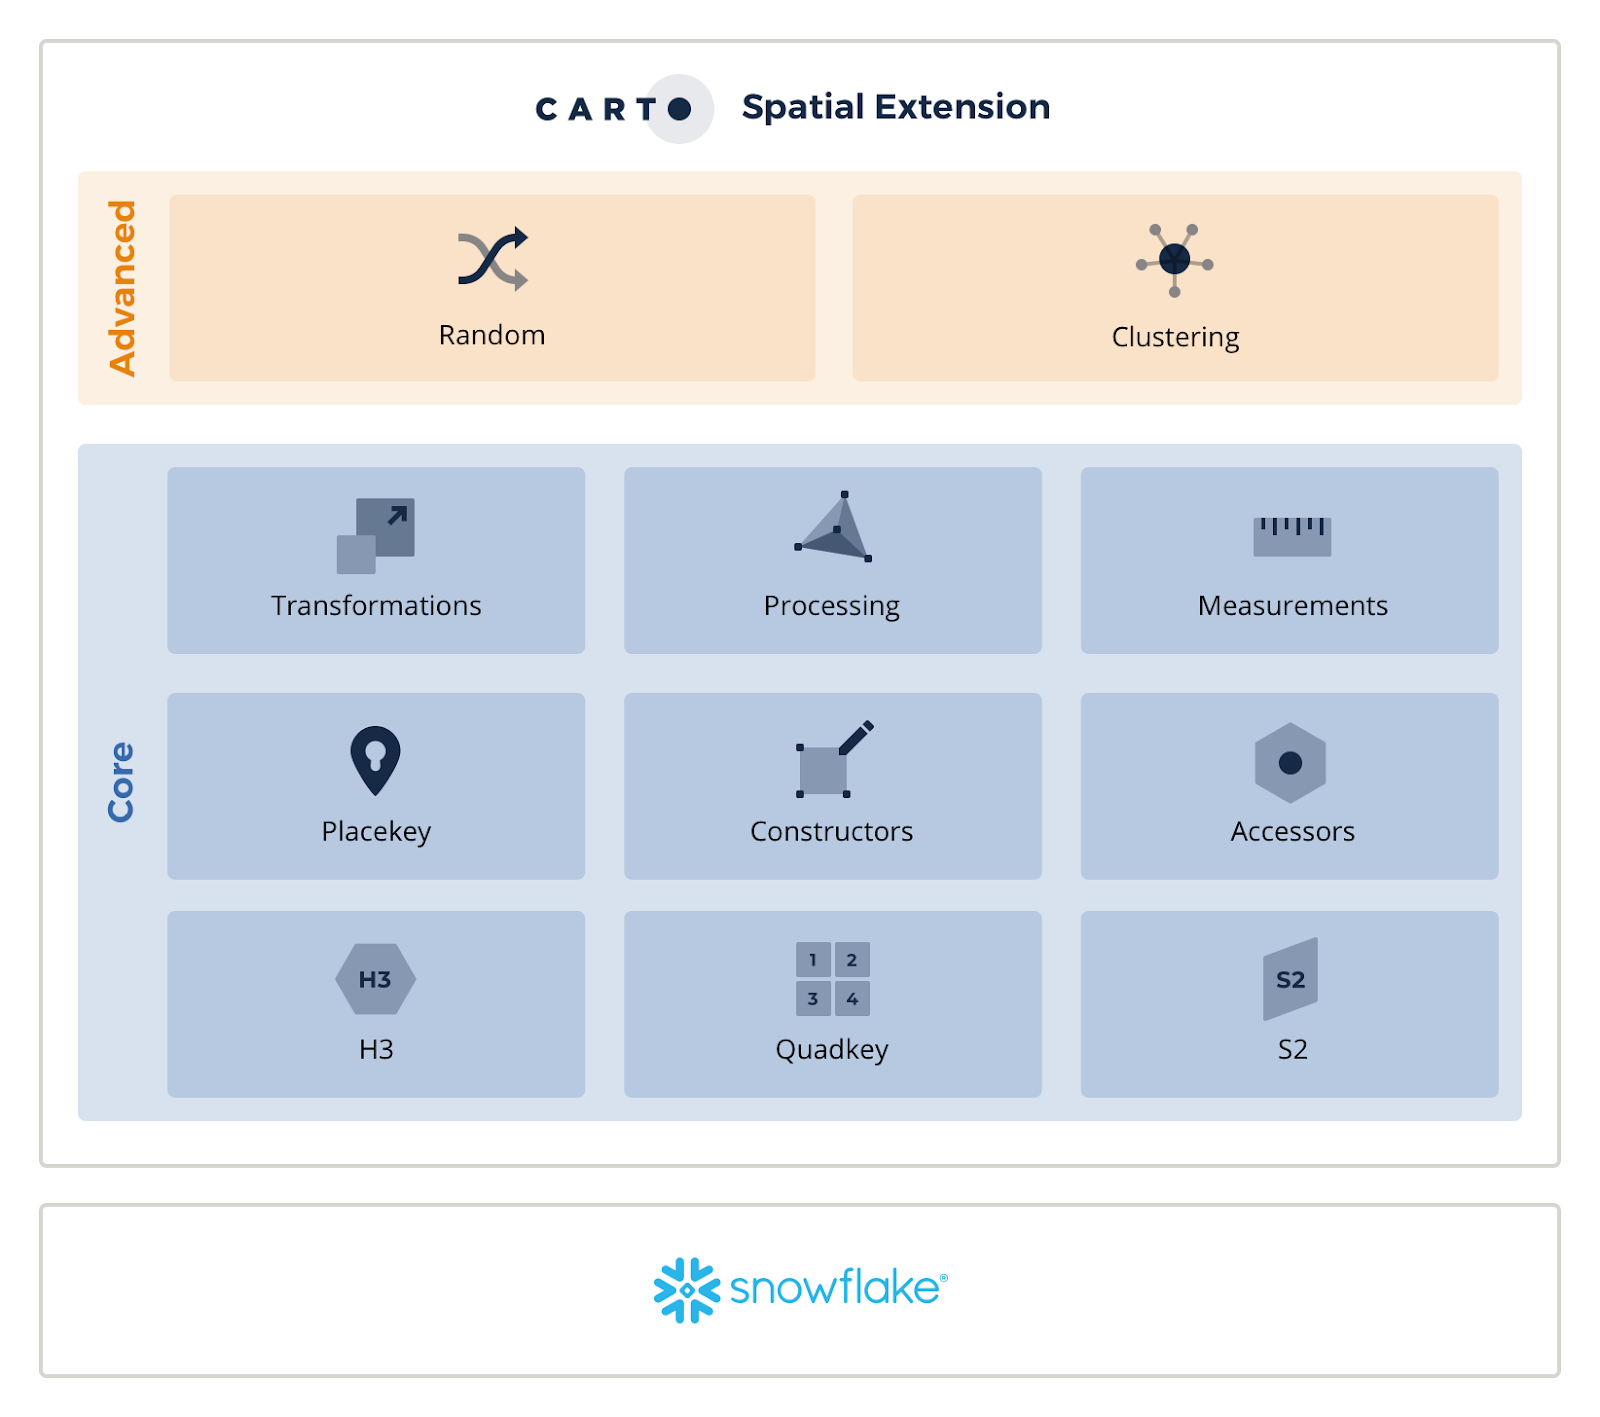
So What Is the Spatial Extension for Snowflake?
The Spatial Extension is a curated set of JavaScript user-defined functions (UDFs) that extend the existing geospatial capabilities in Snowflake. The functions cover some of the most common spatial analysis routines, opening up advanced location-based analytics without the need for complex ETL processes or your data to leave the platform. And all of this is available in a convenient Snowflake data share.
Example Analyses Using the Spatial Extension
First, let’s start by visualizing all Starbucks locations in the U.S., extracted from SafeGraph’s Core Places data set, which is available through Snowflake Data Marketplace.
SELECT ST_MAKEPOINT(LONGITUDE, LATITUDE) as geom FROM CDA26920_STARBUCKS_CORE_PLACES_SAMPLE.PUBLIC.CORE_POIrn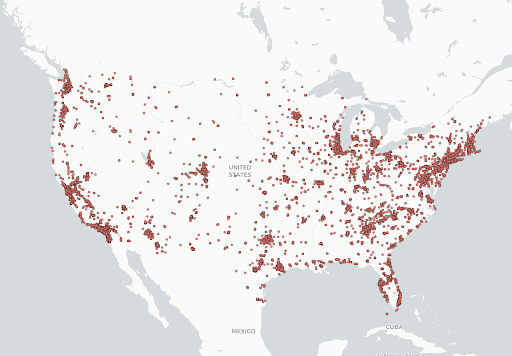
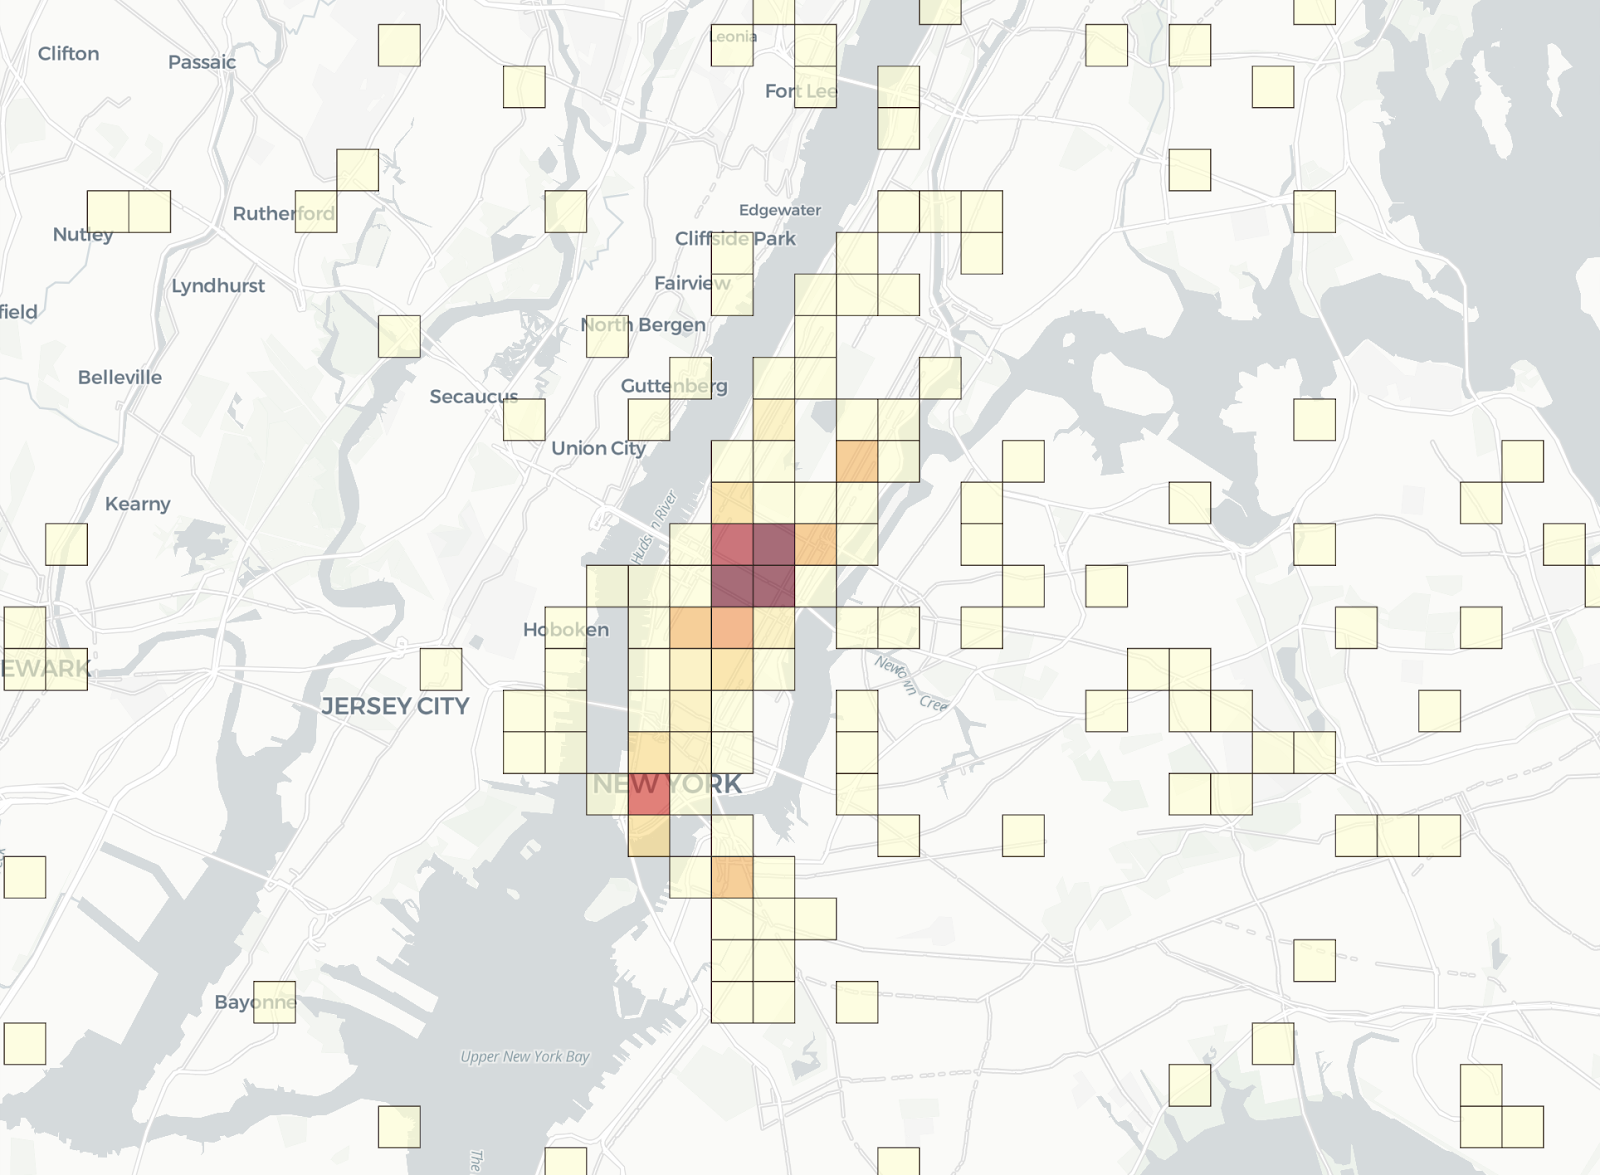
To quickly explore this data, using the Spatial Extension, we can easily compute an aggregation of these locations using quadkeys at resolution 15, which lets us visualize the result as a heatmap. Below is a close-up of the Manhattan area, where we can easily identify the areas of highest concentration of Starbucks stores.
with qks as
(SELECT sfcarto.quadkey.LONGLAT_ASQUADINT(LONGITUDE, LATITUDE, 15) as qk
FROM CDA26920_STARBUCKS_CORE_PLACES_SAMPLE.PUBLIC.CORE_POI)
SELECT count(*) as num_stores, sfcarto.quadkey.ST_BOUNDARY(qk) as geom from qks GROUP BY qk
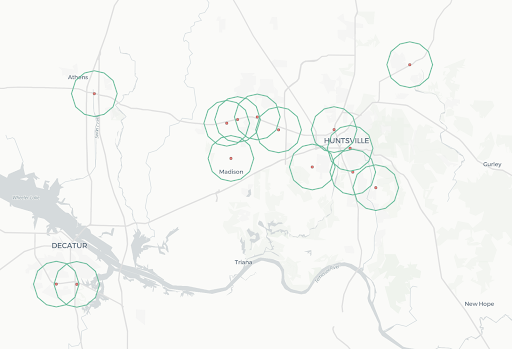
Now, let’s enhance our analysis by computing a 3 km buffer around each store, using the geometry constructor module from the Spatial Extension:
SELECT sfcarto.constructors.ST_MAKEELLIPSE(ST_POINT(LONGITUDE,LATITUDE),3,3,0,'kilometers',12) as geom
FROM CDA26920_STARBUCKS_CORE_PLACES_SAMPLE.PUBLIC.CORE_POI
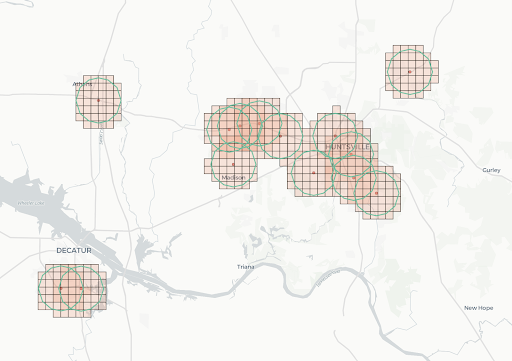
We can then deepen our analysis by computing the quadkeys at resolution 15 that intersect with these buffers using the available polyfill function.
WITH qks AS(
SELECT sfcarto.quadkey.ST_ASQUADINT_POLYFILL(
    sfcarto.constructors.ST_MAKEELLIPSE(ST_POINT(LONGITUDE,LATITUDE),3,3,0,'kilometers',12), 15) AS qk
FROM CDA26920_STARBUCKS_CORE_PLACES_SAMPLE.PUBLIC.CORE_POI
)

SELECT sfcarto.quadkey.ST_BOUNDARY(VALUE) AS geom
FROM qks, lateral FLATTEN(input => qk)
Next, we enrich the resulting quadkeys with the total population and the population by gender using CARTO’s Spatial Features data set, available in Snowflake Data Marketplace. Since this data set is already delivered in quadkeys at resolution 15, enrichment can be performed with simple JOIN.
WITH qks AS(
SELECT sfcarto.quadkey.ST_ASQUADINT_POLYFILL(
    sfcarto.constructors.ST_MAKEELLIPSE(ST_POINT(LONGITUDE,LATITUDE),3,3,0,'kilometers',12), 15) AS qk
FROM CDA26920_STARBUCKS_CORE_PLACES_SAMPLE.PUBLIC.CORE_POI
),
geom_data AS(
SELECT sfcarto.quadkey.QUADKEY_FROMQUADINT(VALUE::BIGINT) AS geoid, sfcarto.quadkey.ST_BOUNDARY(VALUE) AS geom
FROM qks, lateral FLATTEN(input => qk)
GROUP BY VALUE
)
SELECT t1.geom AS geom, population, t2.female, t2.male
FROM geom_data t1
INNER JOIN DATA_MARKETPLACE.CARTO.VIEW_DERIVED_SPATIALFEATURES_USA_QUADGRID15_V1_YEARLY_2020 t2
ON t1.geoid = t2.geoid;
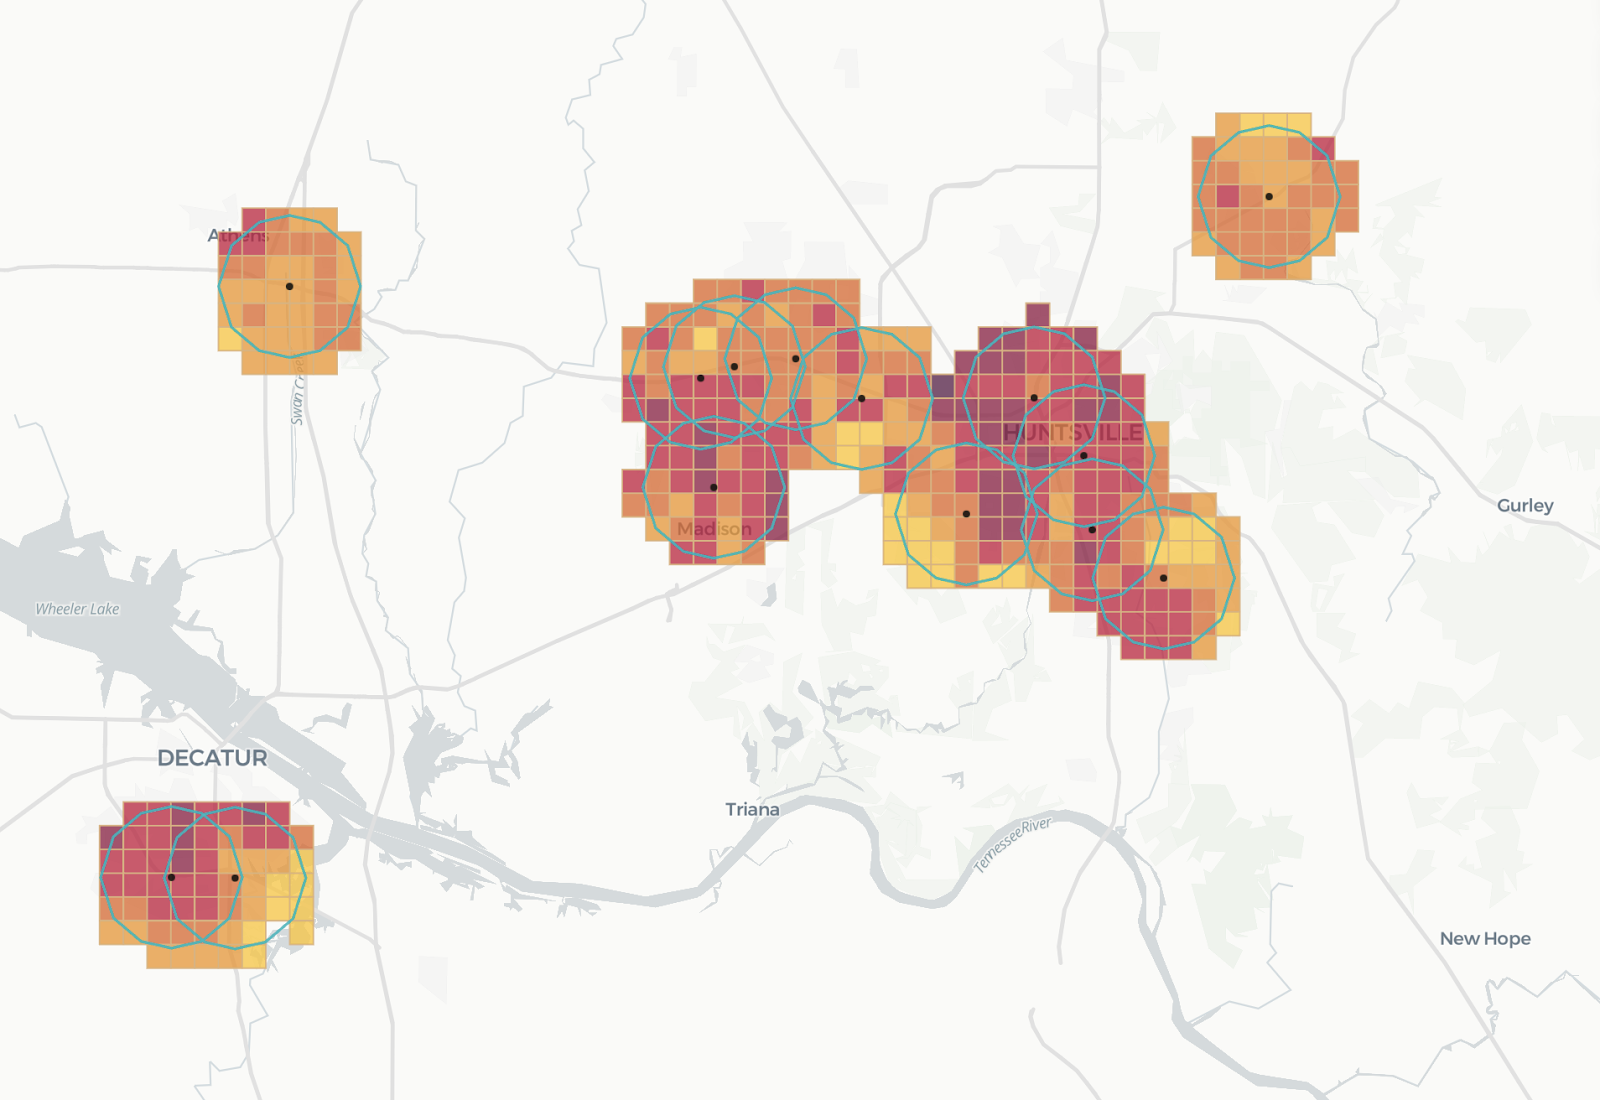
By zooming into a particular area, we can see the distribution of the total population (where darker colors in the following diagram represent higher population levels).
Once we have this data ready, we can calculate the total population that is within a 3 km radius of each store location. This catchment analysis can be performed from start to finish with the following query:
WITH qks AS(
SELECT sfcarto.quadkey.ST_ASQUADINT_POLYFILL(
    sfcarto.constructors.ST_MAKEELLIPSE(ST_POINT(LONGITUDE,LATITUDE),3,3,0,'kilometers',12), 15) AS qk, SAFEGRAPH_PLACE_ID as store_id
FROM CDA26920_STARBUCKS_CORE_PLACES_SAMPLE.PUBLIC.CORE_POI
),

flat_qks AS(
SELECT t1.store_id, sfcarto.quadkey.QUADKEY_FROMQUADINT(VALUE::BIGINT) AS geoid
FROM qks t1, lateral FLATTEN(input => qk)
),

enriched_qks AS(
SELECT t1.store_id, t1.geoid, t2.population, t2.female, t2.male
FROM flat_qks t1
INNER JOIN DATA_MARKETPLACE.CARTO.VIEW_DERIVED_SPATIALFEATURES_USA_QUADGRID15_V1_YEARLY_2020 t2
ON t1.geoid = t2.geoid
),

kpis_per_store AS(
SELECT store_id, SUM(population) as tot_pop, SUM(female) as tot_female, sum(male) as tot_male
FROM enriched_qks
GROUP BY store_id
)

SELECT t1.store_id, t1.tot_pop, t1.tot_female, t1.tot_male, ST_POINT(LONGITUDE,LATITUDE) as geom
FROM kpis_per_store t1
INNER JOIN CDA26920_STARBUCKS_CORE_PLACES_SAMPLE.PUBLIC.CORE_POI t2
ON t1.store_id = t2.SAFEGRAPH_PLACE_ID
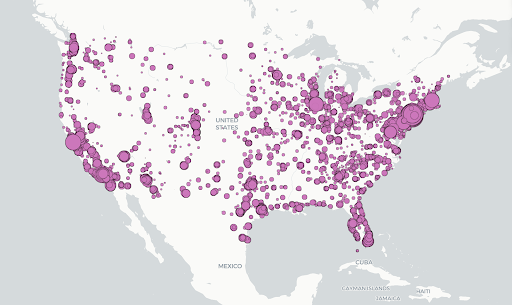
The result is a beautiful map visualization (shown below), where each Starbucks location is represented by a point and whose catchment is proportional to the total population within a 3 km radius:
This is just one example of how some of the 60 or so geospatial functions currently available as part of the CARTO Spatial Extension for Snowflake can be used to seamlessly enhance user data with third-party sources and surface valuable location-based insights right inside the Snowflake Data Cloud.
And given Snowflake’s near-unlimited data storage and processing capabilities, users can simplify their analytical workflows and also meet the performance demands of advanced geospatial analytics in the cloud.
The Spatial Extension for Snowflake can be accessed through Snowflake Data Marketplace.
For more detailed information, check out our Documentation Center, and if you’d like a walk-through of our spatial capabilities for Snowflake, you can sign up here.
Authors
